

Publisher ad revenue is being squeezed from an unusual direction in 2026. Advertisers have not walked away. Readers just arrive less often from Google, so there are fewer pageviews and fewer ad requests to sell. Chartbeat says Google Search referrals across its publisher network fell 40.2% between July 2025 and July 2026, and Ozone’s benchmark of premium publishers found U.S. ad requests down roughly a third in the second quarter, even as prices rose.
That combination changes the job. When volume shrinks and each remaining impression is worth more, the publishers who come out ahead are the ones who protect the value of every session instead of chasing raw pageviews. This guide walks through what the 2026 numbers actually show, the math behind higher eCPMs, and seven moves that hold up when search traffic does not come back.
What the 2026 Data Says About Publisher Ad Revenue
Three independent data sets point the same way.
Search referrals are falling faster. Chartbeat’s 2026 Publisher Playbook, reported by Search Engine Journal on September 24, found Google Search referrals down 40.2% year over year to July 2026, after a 21.9% decline the year before. Google Discover fell 34.3%, up from a 6.6% drop in the prior year. Search went from about 9% of all network pageviews in July 2024 to 5% in July 2026. Chartbeat’s network skews toward news and media sites, so a niche blog may see a different curve, but the direction is hard to ignore.
AI answers explain part of it. In Pew Research Center’s browsing study of 900 U.S. adults, people who saw a Google AI summary clicked a regular result on 8% of visits, compared with 15% when no summary appeared. Links inside the summary itself were clicked on just 1% of those visits. Google has called the study’s method flawed, but the gap is large enough to plan around.
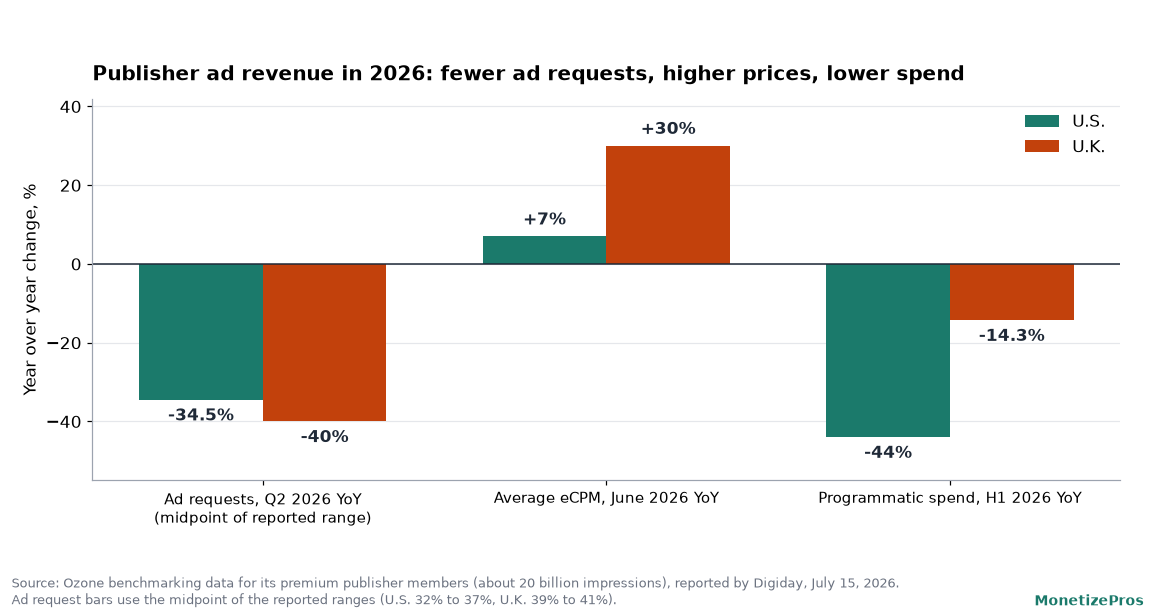
Ad supply is shrinking while prices climb. Ozone, which runs software for a group of premium publishers including the Guardian, News UK, and the Wall Street Journal, tracked about 20 billion impressions. Between April and June 2026, ad request volume was down about 32% to 37% year over year in the U.S. and 39% to 41% in the U.K. In June, average eCPMs were about 7% higher in the U.S. and about 30% higher in the U.K. Combined programmatic spend across the cohort still fell 30.6% in the first half, with the U.S. down 44% and the U.K. down 14.3%.
Put simply, buyers are paying more for each impression, just not enough to cover the impressions that disappeared. “Because we have less ingredients to monetize, ultimately the spend is down,” Ozone’s Liza Simonova told Digiday.
Why Higher eCPMs Rarely Close the Gap
Revenue from display ads is roughly ad requests multiplied by fill rate multiplied by eCPM. If requests fall and fill holds steady, eCPM has to rise by more than the percentage you lost, because each point of lost volume removes a slice of a smaller base.
The break-even rule is simple: required eCPM increase equals 1 divided by (1 minus the request loss), minus 1. Lose 20% of requests and you need eCPMs up 25% just to stand still. Lose a third and you need about 50%. Lose 40% and you need about 67%.
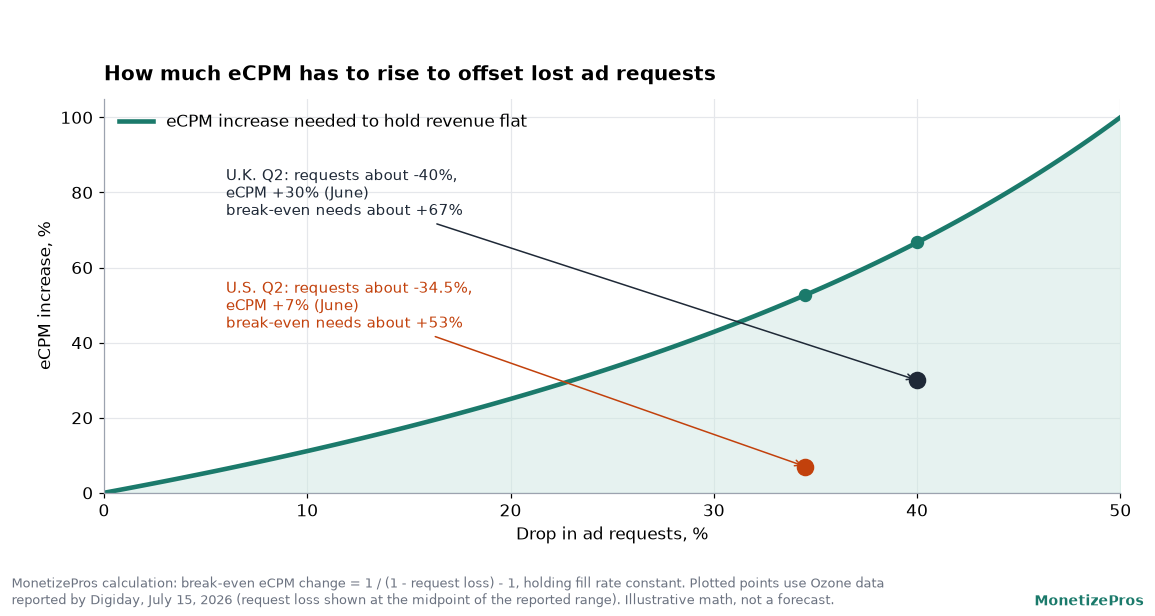
Measured against that curve, the U.S. cohort’s 7% eCPM gain covers only a small part of a roughly one third drop in requests. The U.K. did far better with a 30% gain, which is why its spend fell much less. The lesson for smaller sites is not that prices will save you. It is that price is the lever you control best once volume is outside your control.
Where the Remaining Traffic Comes From
The same Chartbeat data has a more hopeful side. Total pageviews across the network averaged 31.1 billion a month from January to July 2026, only slightly below about 32 billion in 2025. Loyal readers, defined as people who visited on at least eight of the last 16 days, held steady at roughly 15 billion monthly pageviews. Owned and shared channels grew.
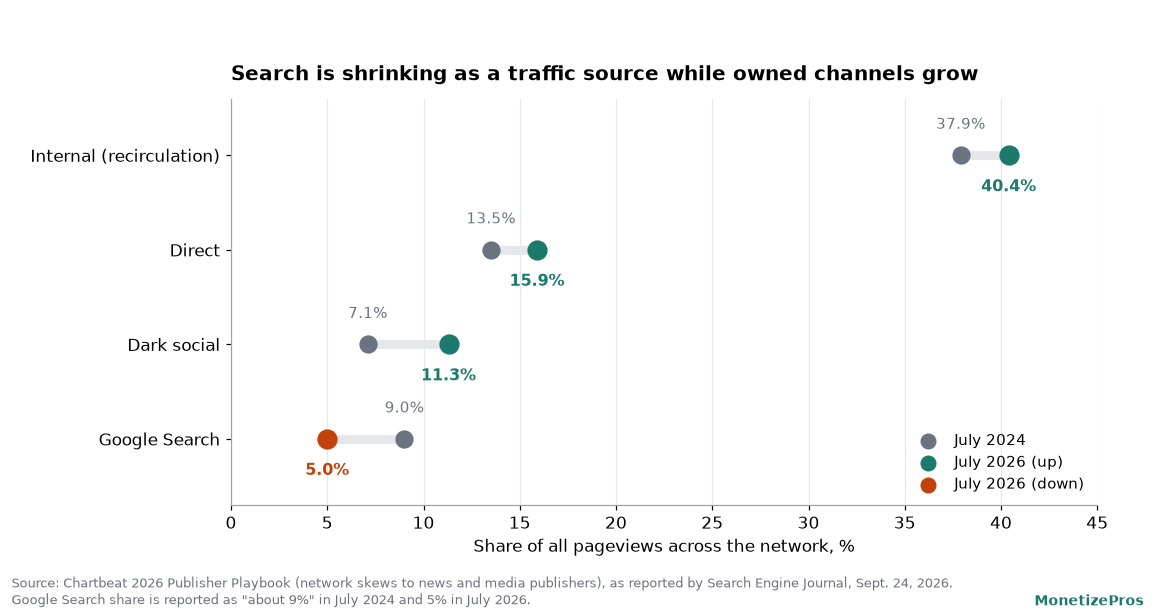
Internal traffic rose from 37.9% to 40.4% of pageviews, direct traffic from 13.5% to 15.9%, and dark social (links shared in texts, DMs, and private groups) from 7.1% to 11.3%. New readers dropped 14% and returning readers dropped 8%, so growth is coming from deeper engagement with people who already know you. That is where the next dollar of ad revenue is most likely to come from.
7 Ways to Protect Publisher Ad Revenue in 2026
1. Track revenue per session, not just RPM
Page RPM can rise while total revenue falls, which is exactly what the Ozone data describes. Add revenue per session and revenue per loyal reader to your weekly dashboard, and split both by traffic source. If search sessions are shrinking but direct sessions earn more per visit, you will see where to invest. Our guide on how to increase your website RPM covers the page level levers.
2. Cut low-value ad calls on purpose
Some of the supply drop in the Ozone data was deliberate. “Some publishers are also deliberately shaping supply, cutting ad load and low-value bid requests to protect or increase attention and price,” INMA’s Gabe Dorosz told Digiday. Review slots that rarely fill, units with poor viewability, and refresh rules that create impressions nobody sees. Fewer, better placements can lift eCPM enough to beat the volume you remove, but test changes on a share of traffic before rolling them out.
3. Grow internal pageviews
Internal recirculation is now the largest single source of pageviews in Chartbeat’s network at 40.4%. Strong related reading modules, clear next steps at the end of every article, and topic hubs that link your best guides together all add pageviews without needing a new visitor. Each extra page in a session is an ad request you did not have to win from Google.
4. Turn loyal readers into known readers
Digiday reports publishers doubling down on logged-in, high-attention environments such as subscriptions, apps, and newsletters, where they control both discovery and pricing. A newsletter list gives you direct traffic on your own schedule and a first-party audience that buyers will pay more to reach. Start with one useful weekly email and a single sign-up prompt placed where engaged readers finish an article.
5. Package scarce inventory for direct and private deals
When open-market supply shrinks, buyers who need your audience have fewer alternatives. That is leverage for direct-sold sponsorships and private marketplace deals with floors that reflect your real audience quality. Our comparison of programmatic direct vs open auction explains how to split inventory between the two.
6. Watch the Safari share of your revenue
Apple’s latest Safari update blocks some ad tech trackers outright. Aditude told Digiday on October 12 that Safari on iPhones and iPads accounts for 11.7% of the ads its customers show and 11.4% of their ad revenue, and that eCPMs among readers on the new version fell 10.5%. With only about 8% of users updated at that point, Aditude put the overall hit near 1%, but that will grow as updates spread. Our breakdown of Safari ads and iOS 27 publisher revenue covers what to check.
7. Add revenue that does not depend on pageviews
Luke Stillman, managing director of Madison and Wall, argued in Digiday’s report that publishers should assume their open web ad business will keep deteriorating and lean harder into subscription and event models. For smaller sites that can mean affiliate content matched to reader intent, paid newsletters, sponsorships, or content licensing. None of these replace display ads overnight, but each one makes your total revenue less sensitive to the next search update.
Frequently Asked Questions
Is publisher ad revenue falling in 2026?
For many publishers that rely on search traffic, yes. Ozone’s premium publisher cohort saw combined programmatic spend fall 30.6% year over year in the first half of 2026, driven by fewer ad requests rather than weaker prices. Sites with strong direct and loyal audiences have held up better.
Why are eCPMs rising if revenue is down?
Scarcity. With fewer impressions available, buyers bid more for each one. But revenue depends on volume as well as price, and the price gains in 2026 have been smaller than the volume losses for most U.S. publishers in the Ozone data.
Should I raise price floors when traffic falls?
Carefully. Higher floors can capture the extra value buyers are willing to pay, but floors set too high reduce fill and can cost more than they earn. Raise them gradually, by placement and geography, and compare total revenue per session before and after, not just eCPM.
The Bottom Line
Publisher ad revenue in 2026 is a value game, not a volume game. Search will likely keep sending fewer readers, so the winning plan is to earn more from each session, keep loyal readers moving through your site, and sell scarce inventory on better terms. Start this week by adding revenue per session to your reporting. It will tell you faster than any other number whether these changes are working.
Sources
We keep outbound links to a minimum. The facts above come from these named sources, checked on October 20, 2026.
- Digiday, Publisher ad supply fell by up to 40% in Q2 as AI search choked the open web, July 15, 2026. Read the Ozone data report
- Search Engine Journal, Google Search decline steepened to 40% YoY for publishers (Chartbeat 2026 Publisher Playbook), September 24, 2026. Read the Chartbeat coverage
- Pew Research Center, Google users are less likely to click on links when an AI summary appears in the results, July 22, 2025. Read the Pew study
- Digiday, Ad industry tallies early losses from Apple’s Safari tracking block, October 12, 2026. Read the Safari report