

A brand posts three times a week. Engagement climbs. Comments roll in. And at the end of the quarter, the CFO still asks the same question: where’s the money?
That gap between a good-looking dashboard and an actual revenue line is where most social strategies quietly fall apart. Budgets get renewed based on what leadership can trace to a dollar amount, not what looks good in a screenshot. So marketers, founders, and anyone who owns a social budget need a different scoreboard, one built around numbers that behave like leading indicators instead of trophies.
Likes, shares, and follower counts describe attention. They don’t describe intent, and intent is the thing that actually shows up on an invoice.
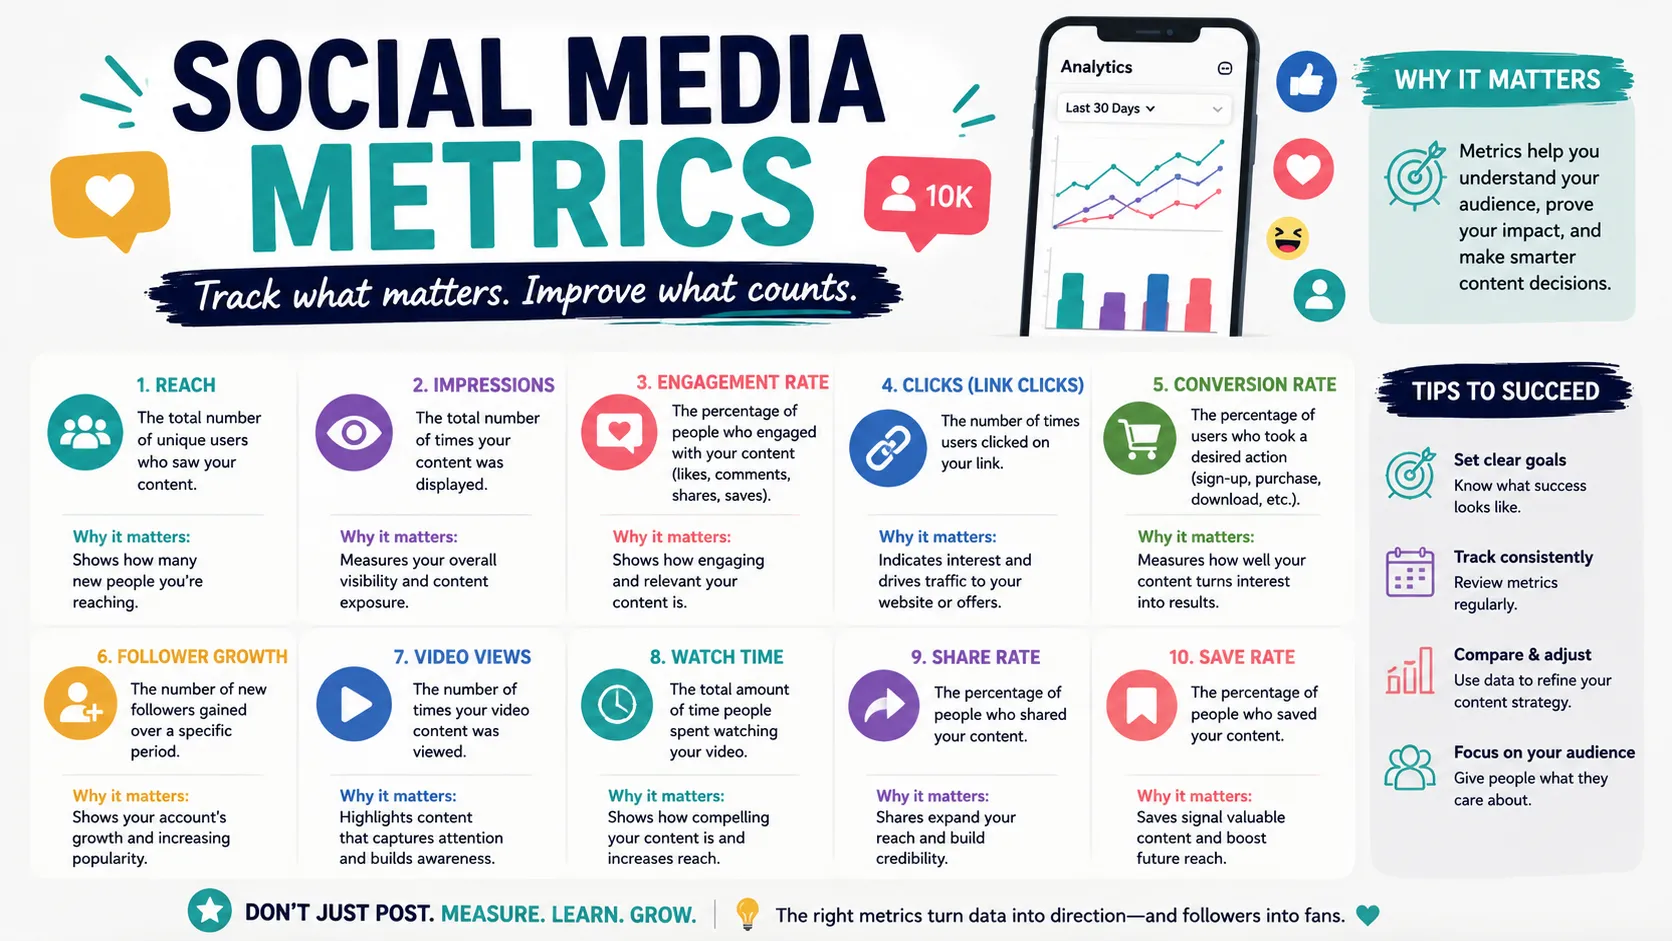
Why Does Engagement Keep Failing to Predict Sales?
Engagement fails as a revenue predictor mostly because platforms made it cheap to produce. A double-tap costs a viewer nothing, so it signals almost nothing about buying intent.
Socialinsider’s 2026 dataset, built from tens of millions of posts, put Instagram engagement near 0.5%, basically flat year over year. Comment volume on TikTok and Instagram actually dropped double digits over the same period, even as brands kept posting at the same pace. Audience behavior shifted toward saves and shares instead. Neither shows up in a standard engagement-rate formula.
That’s the part reports tend to miss. A save is a bookmark for later. A share is a personal endorsement, made in front of someone’s own network. Both carry more weight than a like, and neither gets counted the same way twice.
Engagement rate answers one question: did people notice this? Revenue-predictive metrics answer a harder one: did people move?
Which Metrics Actually Move the Needle on Revenue?
A short list, in order of how often teams overlook them:
- Click-through rate (CTR) on owned links. Not impressions. Not reach. A click means someone crossed a threshold a passive scroll never will.
- Cost per acquisition (CPA) and cost per lead (CPL). These translate ad spend directly into pipeline value.
- Save-to-like ratio and share-to-reach ratio. IQFluence’s 2026 creator benchmarking found a modest 1.8%-engagement account with a 4x save-to-like ratio consistently outperforming a flashier 4%-engagement account whose audience only double-taps.
- Assisted conversions. Multi-touch attribution that credits social for its role earlier in a buyer’s journey, even when the purchase happens elsewhere.
- Comment-to-like ratio, especially in B2B. Forty likes and twenty-five comments means real conversation. Two hundred likes and three comments means a courtesy tap.
- Repeat visit rate from social traffic. Someone returning via a social link a second or third time is signaling more purchase readiness than any single click.
Most of these already exist inside a platform’s native analytics. Teams just default to whatever’s easiest to screenshot for a monthly deck.
The Two Signals Almost Nobody Reports On
Here’s where most benchmark articles stop. Two things worth adding, because they rarely show up in standard reporting and they matter more every quarter.
The first is branded search lift. A campaign that underperforms on engagement can still push people to search the brand name directly, on Google or inside an AI assistant, days after seeing the post. That search volume doesn’t attach to the original post in any dashboard. It shows up as a bump in direct traffic a week later, disconnected from the campaign that caused it. Teams that check Search Console or branded query volume around a launch window sometimes find the real payoff there, not in the post’s own numbers.
The second is what some analysts now call dark attribution. Someone sees a product mentioned on social, doesn’t click, and later asks ChatGPT or a similar assistant something like “is this brand any good” or “what’s a comparable option.” That conversation never touches an analytics platform, yet it’s real influence, currently invisible to almost every attribution model in use. Nobody has solved this cleanly yet, but ignoring it doesn’t make it go away either.
How Do You Build Attribution That Survives a Budget Review?
Connect social touchpoints to a CRM record. Not just a platform dashboard.
First-touch and last-touch models each tell half a story. Industry research on attribution gaps suggests most brands undercount social’s contribution to revenue by roughly 30% to 50%, largely because tracking stops the moment someone clicks.
Picture a prospect who saves a carousel post in March, clicks a link in April, and buys in June after a retargeting email. Last-click hands all the credit to email. First-click hands it to social. A multi-touch model, even an imperfect one, closes most of that gap. It won’t be perfect. It’ll be closer to true.
One practical lesson that comes up repeatedly in attribution work is that reporting usually isn’t the first thing that needs fixing. As one strategist at UAATEAM SMM agency puts it, “Don’t add another dashboard until your UTMs are consistent and your CRM is actually capturing the social touchpoint. Otherwise you’re just reporting inaccurate data more efficiently.” Once the tracking is reliable, the metrics themselves become much easier to interpret.
Does Platform Choice Change Which Metrics Matter?
Yes, and one anonymized example makes the point better than a general rule would.
An ecommerce brand ran near-identical product videos on TikTok and Instagram Reels. The TikTok version pulled a lower engagement rate. On paper, it looked like the weaker post. But it generated roughly twice the profile visits of the Reels version, and branded search volume for the product name rose the following week in a way the Reels post never produced. The likes told one story. Profile visits and search lift told the one that mattered to sales.
That’s the pattern worth internalizing: TikTok’s algorithm tends to reward watch time and shares in ways that show up downstream, not always in the engagement number itself. LinkedIn audiences often arrive with stronger built-in intent, so CTR and comment quality carry more signal there than raw volume. Meta’s ad infrastructure rewards patience, with typical cost-per-engagement reductions of 20% to 30% as a campaign matures and creative gets tested. None of that is visible from an engagement-rate column alone.
What Should a Revenue Dashboard Actually Look Like?
- Imagine opening your monthly social report and hiding every metric that can’t explain a business outcome. Likes disappear. Follower growth moves to the bottom of the page. What’s left are CTR, assisted conversions, repeat visits, branded search lift, and the quality of the conversations your content starts.
- That’s a much smaller dashboard than most teams are used to. It’s also a far more useful one. The purpose of reporting isn’t to prove that people saw your content. It’s to understand whether they did something because of it.
- If your dashboard stops at the click, it probably stops before the sale.
Engagement metrics still have a job. They’re useful for reading content fit and audience resonance. But when a budget conversation turns to revenue, the numbers that hold up are the ones tracking intent, movement, and what happens after someone leaves the feed.
If your dashboard stops at the click, it probably stops before the sale.